Chemical Profiling of the Aerial Parts and Roots of Ixeris dentata Using LCQTOF-MS Combined with Multivariate Chemometric Analysis
Park JH, Park SJ, Yoo G, Kwak HJ, Oh Y and Kim SH
DOI10.21767/2472-0151.100032
Park JH, Park SJ, Yoo G, Kwak HJ, Oh Y and Kim SH*
College of Pharmacy, Yonsei Institute of Pharmaceutical Science, Yonsei University, 85 Songdogwahak-ro, Yeonsu-gu, Incheon 21983, Korea
- *Corresponding Author:
- Kim SH
College of Pharmacy
Yonsei Institute of Pharmaceutical Science
Yonsei University
85 Songdogwahak-ro, Yeonsu-gu, Incheon 21983
Korea
Tel: +82-32-749-4514
E-mail: kimsh11@yonsei.ac.kr
Received date: November 10, 2017; Accepted date: November 20, 2017; Published date: November 25, 2017
Citation: Park JH, Park SJ, Yoo G, Kwak HJ, Oh Y, et al. Chemical Profiling of the Aerial Parts and Roots of Ixeris dentata Using LC-QTOF-MS Combined with Multivariate Chemometric Analysis. Herb Med. 2017, Vol.3 No.2:12.doi: 10.21767/2472-0151.100032
Copyright: © 2017 Park JH, et al. This is an open-access article distributed under the terms of the Creative Commons Attribution License, which permits unrestricted use, distribution, and reproduction in any medium, provided the original author and source are credited.
Abstract
Ixeris dentata (Thunb. ex Thunb.) Nakai (Asteraceae) is a perennial herb distributed throughout East Asia including Korea, China and Japan. Both its aerial parts and roots are edible as a bitter appetizing vegetable. In addition, they have been used in folk medicine for the treatment of various diseases. In the present study, the chemical profiles of the aerial parts and roots of I. dentata were investigated using HPLC-QTOF-MS combined with multivariate chemometric analysis. From 18 samples collected in 7 different areas, 30 compounds were characterized and most of them were sesquiterpenes and flavonoids. Principal component analysis of them clearly distinguished the samples of I. dentata by the parts, aerial parts and roots. The loading plots gave the information about the important compounds responsible for the discrimination between plant parts. Hierarchical cluster analysis also showed clear distinction between two parts. Although I. dentata samples derived from the same plant, there was difference in their chemical profiles, which might account for their different uses.
Keywords
Ixeris dentata; Chemical profiling; LC-QTOFMS; Multivariate chemometric analysis
Introduction
Ixeris dentata (Thunb. ex Thunb.) Nakai (Asteraceae) is a perennial herb distributed throughout East Asia including Korea, China and Japan. Both its aerial parts and roots are edible and have been used as appetizing vegetables due to their bitter taste. Moreover, they have been used for the treatment of various diseases including pneumonia, hepatitis, indigestion, and tumor in Korean traditional and folk medicine [1-5]. Regarding the chemical constituents, aliphatic compounds, triterpenoids, and sesquiterpene glycosides have been reported from I. dentata [6-8]. In our previous studies, we reported that I. dentata has anti-inflammatory activity and increase amylase synthesis and secretion and suggested sesquiterpene glycosides as active components [9-10].
The chemical characteristics of natural products can be varied according to geographic origins, cultivation conditions, and harvesting season [11-13]. Moreover, it is well known that the different parts even derived from the same plant have distinct chemical properties. Different chemical properties subsequently cause different biological actions. Since the biological activity of natural products depends not only on several major constituents but also on its complex chemical components and their interactions, it is important to develop an efficient analytical method to evaluate their chemical properties. One of the most commonly used approaches to investigate the chemical profiles of herbs is liquid chromatography (LC) coupled to a mass spectrometer (MS) [14-17]. Particularly, quadrupole time-of-flight MS (QTOF-MS) system is a powerful tool for chemical profiling of plants due to its excellent resolving power, a high acquisition speed, accurate mass measurement as well as sensitive spectral scan [18]. Chromatographic analysis employing powerful detector such as QTOF-MS provides rich information about investigated samples buried in complex data. Therefore, it is an important step to extract meaningful information from complex highly multivariate data. Many chemometric tools, including principal component analysis (PCA), hierarchical cluster analysis (HCA), artificial neural network (ANN), alternative moving window factor analysis (AMWFA), and so on, have been used to find the information from chromatographic analysis coupled with various detectors [19]. The main advantages of these multivariate analysis, particularly PCA, is that it can reduce the dimensionality of a data set consisting of a large number of interrelated variables, while retaining as much as possible of the variation present in the data set. It becomes easier to compare or cluster the data set of chromatographic analysis due to the complexity reduction and the data simplification by chemometric tools.
In the present study, the chemical profiles of the aerial parts and roots of I. dentata were investigated using LC-QTOF-MS. Based on the MS spectra, compounds comprising the chemical profiles were characterized. PCA and HCA were used to compare the chemical profiles of the aerial parts and roots of I. dentata.
Materials and Methods
Plant materials and sample preparation
National Institute of Horticultural and Herbal Science of Korea provided the aerial parts (IDA) and roots (IDR) of I. dentata collected in 7 different provinces of Korea. The dried IDA and IDR were extracted 3 times with 80% methanol (30 ml, 50°C) under sonication for 6 hr and evaporated under vacuum. The extracts were dissolved in 50% methanol at the concentration of 1 mg/ml. Each sample was filtered through a 0.2 μm nylon syringe filter before LC-QTOF-MS analysis. All samples were coded as shown in Table 1.
| Geographical origin | Sample code | Aerial parts | Roots |
|---|---|---|---|
| Chuncheon | CC | IDA CC | IDR CC |
| Dangjin 1 | DJ1 | IDA DJ1 | IDR DJ1 |
| Dangjin 2 | DJ2 | IDA DJ2 | IDR DJ2 |
| Eumseong 1 | ES1 | IDA ES1 | IDR ES1 |
| Eumseong 2 | ES2 | IDA ES2 | IDR ES2 |
| Goesan | GS | IDA GS | IDR GS |
| Jinan | JA | IDA JA | IDR JA |
| Jinbu | JB | IDA JB | IDR JB |
| Yangpyeong | YP | IDA YP | IDR YP |
Table 1: Description of I. dentata aerial parts and roots samples.
LC-QTOF-MS analysis
HPLC was performed with an Agilent 1290 HPLC system (Agilent Technologies, Santa Clara, CA, USA), equipped with a 1290 Infinity binary pump, auto-sampler and PDA detector. The separation was performed on an YMC hydrosphere C18 (4.6 mm i.d.×250 mm, 5 μm) column. The mobile phase was a stepwise gradient between 0.5% acetic acid in water and acetonitrile (0 min, 7% acetonitrile; 13 min, 11% acetonitrile; 30 min, 18% acetonitrile; 45-55 min, 28% acetonitrile) at a flow rate of 1 ml/min. The column temperature was set at 30°C. On-line UV spectra were recorded in the wavelength range 190– 400 nm.
The HPLC system was connected to an Agilent 6530 time-offlight mass spectrometer (Santa Clara, CA, USA) equipped with an electrospray ionization (ESI) interface using the following operation parameters: capillary voltage, 3.5 kV; nebuliser, 30 psig; drying gas (nitrogen) flow rate, 10.0 l/min; drying gas temperature, 325°C; fragmentor, 175 V; skimmer voltage, 65 V; octopole radio frequency, 250 V.
All MS data were acquired using the MassHunter Data acquisition software to ensure mass accuracy and reproducibility throughout the chromatographic run. The data acquisition factors were applied to collect the data: the acquisition type set at MS and the mass range was m/z 100- 1500 for centroid mode. Moreover, the acquisition rate was 4 spectra per second for MS. The [M+H]+ ions of m/z 121.0508 and 922.0098 were used as the reference mass for the positive ESI mode.
Establishment of in-house library
By searching from databases including Dictionary of Natural product (CRC, 2009), SciFinder Scholar of the American Chemical Society, and ScienceDirect of Elsevier, all components reported from Ixeris genus in the literatures were summarized in a MassHunter Personal Compound Database and Library (PCDL) manager (Agilent Technologies, Santa Clara, CA, USA). In-house library was established including the compound name, molecular formula and exact mass of each compound.
Chromatographic peak identification
Compound identification relied on UV spectra, retention time, and reasonable molecular formulas calculated from accurate mass measurements obtained from LC-QTOF-MS analysis. When authentic standard compounds were available, comparison by UV and retention time were used for peak identification. Other compounds were characterized by matching the experimental molecular formula with that of inhouse library using “Find Compounds by Molecular Feature” and “Search Database” of MassHunter Qualitative analysis software (Version B.06.00, Agilent Technologies, Santa Clara, CA, USA).
Multivariate analysis
Considering the quality score and error values, 30 peaks with the information about the accurate molecular weights and peak intensity were selected for multivariate analysis. The extracted chromatographic data was imported as data matrix for PCA and HCA. The data set was normalized by auto-scaling method, i.e., the average was subtracted from each variable, with each variable divided by its standard deviation before multivariate analysis. PCA and HCA were conducted using the MassHunter Mass Profiler Professional software (MPP, Version B.13.11, Agilent Technologies, Santa Clara, CA, USA).
Results and Discussion
Various columns and solvent systems were applied to optimize chromatographic condition for the chemical profiling of I. dentata. An appropriate concentration of acetic acid in water (0.5%) was selected and showed a relatively stable baseline of chromatogram during the analysis. In addition, several HPLC columns were tested using the optimized solvent condition. Among them, YMC hydrosphere C18 (4.6 mm i.d.×250 mm, 5 μm) showed better resolution. For QTOF-MS conditions, better sensitive ionization was achieved using positive ion mode than negative ion mode.
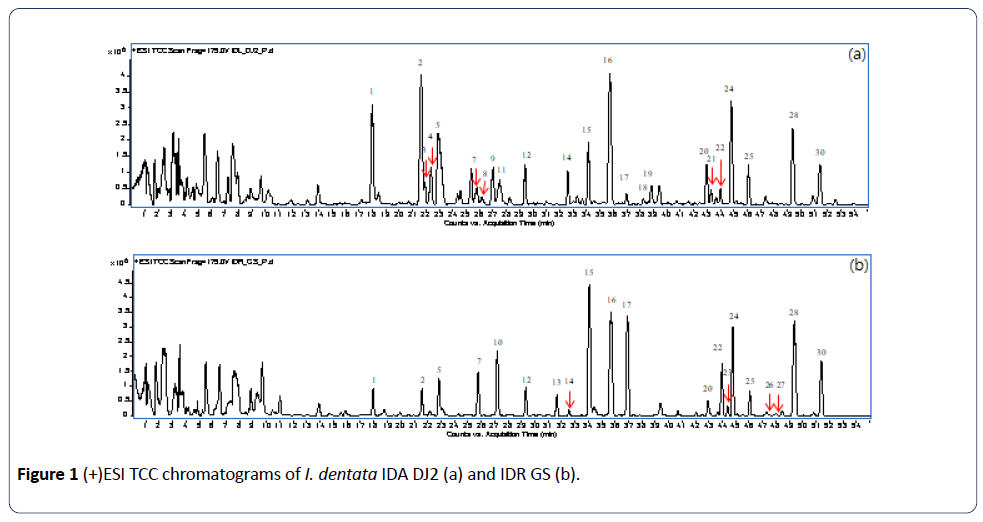
The optimized LC-QTOF-MS condition was applied to analyze the extracts of I. dentata. The total compound chromatograms (TCC) of the aerial parts and leaves of I. dentata were shown in Figure 1.
Although many peaks were present both in the chromatograms of the aerial parts and roots, most of them showed differences in peak intensity and some of them were observed in only one part.
Taking into account the uneven mass and the isotopic distribution, 30 peaks were obtained at 5 ppm accuracy. Among them, compounds were identified based on the combination of accurate mass, UV spectrum and retention time (Table 2). Thirteen compounds isolated in our previous study were used as standard compounds to confirm the identification of the observed peaks in TCC [10]. Peaks for these thirteen compounds (peaks 5, 6, 8, 9, 11, 12, 15, 19, 21, 22, 25, 28, 29) were found in TCC. Most of the identified compounds were sesquiterpene glycosides. Others were sesquiterpenes, flavonoid glycosides and phenolic compounds (Table 2).
| Peak | Compound | Formula | Mass | m/z | Error (ppm) | IDAR |
|---|---|---|---|---|---|---|
| 1 | Ixerochinolide | C23H24O6 | 396.139 | 397.1467 [M+H]+ | 0.81 | A/R |
| 2 | Dentatin C | C21H30O9 | 426.189 | 444.2224 [M+NH4]+ | 1.04 | A/R |
| 3 | Ixerin W | C21H28O8 | 408.176 | 409.1831 [M+H]+ | 0.38 | A |
| 4 | Sonchifoliasolide B | C23H24O6 | 396.139 | 397.1464 [M+H]+ | 0.51 | A |
| 5 | 11β,13-Dihydroglucozaluzanin C | C21H30O8 | 410.155 | 411.1623 [M+H]+ | 1.22 | A/R |
| 6 | Chlorogenic acid | C16H18O9 | 354.095 | 377.084 [M+Na]+ | 0.68 | A/R |
| 7 | Ixerin E | C21H32O9 | 428.204 | 451.194 [M+Na]+ | 0.48 | A/R |
| 8 | Crepidiaside C | C21H30O9 | 426.189 | 449.178 [M+Na]+ | 0.83 | A |
| 9 | 8β-Hydroxy-4β,15-dihydrozaluzanin C | C15H20O4 | 264.136 | 287.1254 [M+Na]+ | 0.18 | A |
| 10 | Dentatin B | C21H30O9 | 426.189 | 444.2224 [M+ NH4]+ | 0.29 | R |
| 11 | Lactuside A | C21H30O9 | 426.189 | 449.1779 [M+Na]+ | -0.43 | A |
| 12 | 8-Epidesacylcynaropicrin glucoside | C21H28O9 | 424.173 | 442.2067 [M+NH4]+ | 1.15 | A/R |
| 13 | Ixerin D | C21H30O9 | 426.189 | 449.1779 [M+Na]+ | 0.58 | R |
| 14 | Ixerisoside E | C21H30O9 | 426.188 | 444.2223 [M+NH4]+ | 1.28 | A/R |
| 15 | Dentatin A | C21H32O9 | 428.204 | 446.2383 [M+NH4]+ | 0.56 | A/R |
| 16 | unknown | C30H44O3 | 452.336 | 475.3251 [M+Na]+ | A/R | |
| 17 | Ixerisoside C | C21H30O9 | 426.189 | 449.1779 [M+Na]+ | 0.82 | A/R |
| 18 | Luteolin 7-rutinoside | C27H30O15 | 594.158 | 595.1656 [M+H]+ | 0.27 | A |
| 19 | Luteolin 7-O-glucoside | C21H20O11 | 448.1 | 449.1076 [M+H]+ | 0.64 | A |
| 20 | unknown | C24H34O4 | 386.241 | 409.2306 [M+Na]+ | A/R | |
| 21 | Apigenin 7-O-glucoside | C21H20O10 | 432.105 | 433.1126 [M+H]+ | 0.88 | A |
| 22 | 4-Allyl-2,6-dimethylphenyl glucoside | C17H24O8 | 356.147 | 379.1362 [M+Na]+ | 0.59 | A/R |
| 23 | Ixerin S | C26H36O11 | 524.225 | 542.2592 [M+NH4]+ | 0.86 | R |
| 24 | unknown | C32H38O16 | 678.504 | 701.4933 [M+Na]+ | A/R | |
| 25 | Ixerin M | C26H36O11 | 524.226 | 542.2595 [M+NH4]+ | 0.23 | A/R |
| 26 | Ixerin V | C21H32O8 | 412.209 | 435.1984 [M+Na]+ | 1.23 | R |
| 27 | Ixerin I | C29H36O11 | 560.225 | 578.2586 [M+NH4]+ | 1.87 | R |
| 28 | Ixerisoside A | C29H34O11 | 558.21 | 576.2436 [M+NH4]+ | 0.63 | A/R |
| 29 | Ixerin N | C27H38O11 | 538.241 | 556.2747 [M+NH4]+ | 1.17 | A/R |
| 30 | unknown | C21H36O7 | 400.257 | 423.2462 [M+Na]+ | A/R |
Table 2: Compounds identified or tentatively identified in I. dentate.
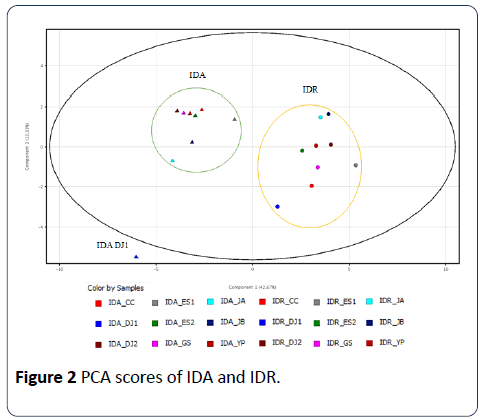
The data set of the peak intensity of 30 peaks was subjected to a PCA in order to decrease the data dimension. Prior to submitting the data set to PCA, data was normalized to avoid variables with high intensities being necessarily considered as more important than those with low intensities. PCA extracted two significant principal components (PC) which contributes 42.67% and 12.33% of data variance, respectively. PCA score plots generated from 18 samples showed one outlier, IDA DJ1 where the ellipse marks the 95% Hotelling T2 control chart (Figure 2).
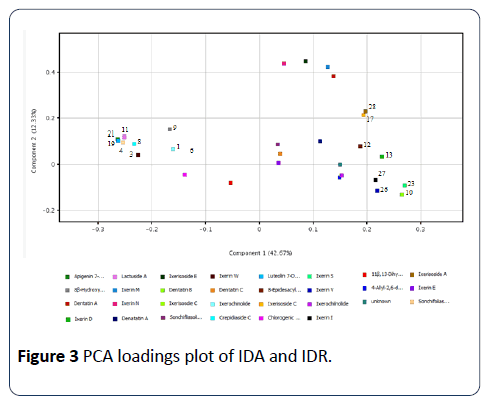
With this single exception, I. dentata samples were nicely separated according to the parts used by PC1 scores, negative PC1 scores for the aerial parts and positive PC1 scores for the roots, respectively. Although IDA DJ1 is an outlier, it also showed a negative PC1 score. There was no significant difference depending on the geographic origins. The root samples showed bigger variances in PC2 scores compared to the aerial part samples. The loading values of the variables associated with the first two PC2 are displayed in Figure 3.
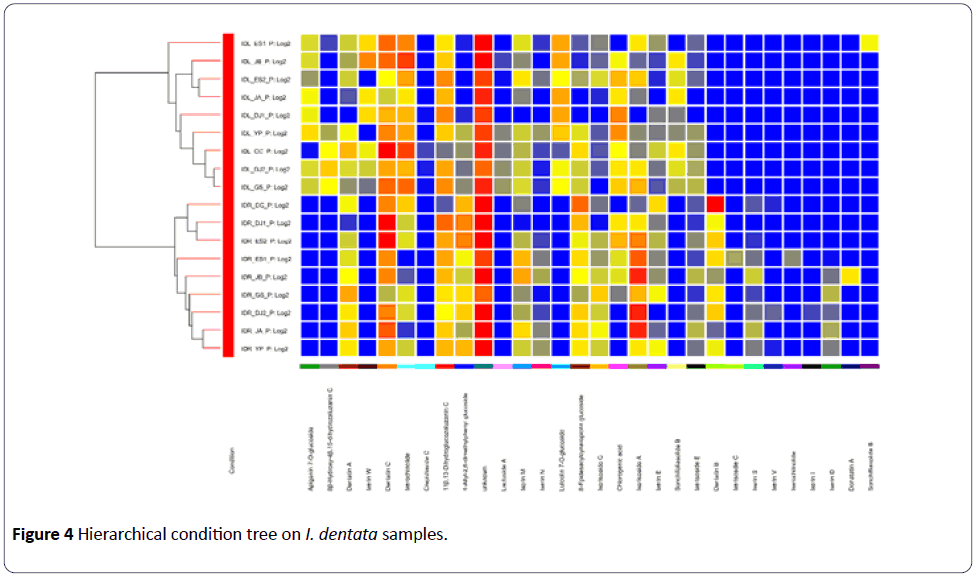
The loading values for peaks 3, 4, 8, 11,19,21 had negative values on PC1, which indicated that these compounds are mainly responsible for the separation of aerial part samples from the root samples. Peaks 10, 13, 23, 26, 27 had the largest positive values on PC1 showing that they also contribute the separation between the parts used. A similar result was deduced from HCA showing two distinct clusters of chemical profiles according to the parts used for the analysis (Figure 4).
These results are in accordance with the chromatographic data. The peaks observed only in IDA were 3, 4, 8, 9, 11, 18, 19 and 21. As expected, flavonoid glycosides, peaks 18, 19 and 21 were found only in the aerial parts. On other hand, peaks 10, 13, 23, 26 and 27 were absent in the aerial parts. The other peaks were observed both in the aerial parts and roots. However, the peaks 1, 2, 14 showed stronger intensities in the aerial parts (Figure 1).
Taken together, both the aerial parts and roots of I. dentata are rich in sesquiterpene glycosides. However, the contents and distribution of these compounds differ from each other. Although I. dentata has been used as an edible vegetable and a medicinal plant for a long time, the information about the plant parts for specific purpose has not been clear enough. This study showed the differences of the chemical characteristics between IDA and IDR, which suggests the possible differences of biological actions between them.
Conclusions
Using LC-QTOF-MS analysis, the chemical profiles of IDA and IDR were obtained, respectively. Sesquiterpene glycosides such as 11β,13-dihydroglucozaluzanin C (5), 8- epidesacylcynaropicrin glucoside (12), dentatin A (15), ixerin M (25), ixerisoside A (28) were found to be the major characteristic compounds of I. dentata. The PCA score plot of the MS data showed clear separation between IDA and IDR. It could be confirmed by the HCA. The PCA loading plot gave the information about the compounds which are important for this separation. It was confirmed using TCC of each part. Taken together, the chemical characteristics can be different according the part used even in the same plant, suggesting the need for further research study about the biological differences according to plant parts.
Acknowledgements
This work was carried out with the support of Cooperative Research Program for Agriculture Science & Technology Development (Project No. PJ011581042017) funded by the Rural Development Administration, Republic of Korea.
References
- Ahn EM, Bang MH, Song MC, Park MH, Kim HY, et al. (2006) Cytotoxic and ACAT-inhibitory sesquiterpene lactones from the root of Ixeris dentata forma albiflora. Archives of Pharmacal Research 29: 937-941.
- Chung HS, Jeong HJ, Han MJ, Park ST, Seong KK, et al. (2002) Nitric oxide and tumor necrosis factor-α production by Ixeris dentata in mouse peritoneal macrophages. Journal of Ethnopharmacology 82: 217-222.
- Heo BG, Chon SU, Park YJ, Bae JH, Park SM, et al. (2009) Antiproliferative activity of Korean wild vegetables on different human tumor cell lines. Plant Foods for Human Nutrition 64: 257.
- Hong S, Jeong D, Kim K, Hwang E (2010) The composition of the root of Ixeris dentata var. albiflora Nakai. and cell viability and DPPH radical scavenging activities of its extract. Korean Journal of Nutrition 43: 105-113.
- Oh SH, Sung TH, Kim MR (2003) Ixeris dentata extract maintains glutathione concentrations in mouse brain tissue under oxidative stress induced by kainic acid. Journal of Medicinal Food 6: 353-358.
- Asada H, Miyase T, Fukushima S (1984) Sesquiterpene lactones from Ixeris tamagawaensis KITAM. III. Chemical and Pharmaceutical Bulletin 32: 3403-3409.
- Nishimura K, Miyase T, Ueno A, Noro T, Kuroyanagi M, et al. (1985) Sesquiterpene lactones from Ixeris stolonifera A. Gray. Chemical and Pharmaceutical Bulletin 33: 3361-3368.
- Warashina T, Ishino M, Miyase T, Ueno A (1990) Sesquiterpene glycosides from Ixeris debilis and Ixeris repens. Phytochemistry 29: 3217-3224.
- Lee HY, Lee GH, Kim HK, Kim SH, Pyo PK, et al. (2013) Ixeris dentata-induced regulation of amylase synthesis and secretion in glucose-treated human salivary gland cells. Food and Chemical Toxicology 62: 739-749.
- Park S, Nhiem NX, Lee TH, Kim N, Kim SY, et al. (2015) Isolation of two new bioactive sesquiterpene lactone glycosides from the roots of Ixeris dentata. Bioorganic & Medicinal Chemistry Letters 25: 4562-4566.
- Chen WC, Lai YS, Lu KH, Lin SH, Liao LY, et al. (2015) Method development and validation for the high-performance liquid chromatography assay of gastrodin in water extracts from different sources of Gastrodia elata Blume. Journal of Food and Drug Analysis 23: 803-810.
- Lucio GJR, Coello J, Maspoch S (2012) Enhanced chromatographic fingerprinting of herb materials by multi-wavelength selection and chemometrics. Analytica Chimica Acta 710: 40-49.
- Zhuang H, Ni Y, Kokot S (2014) Combining HPLC–DAD and ICP-MS data for improved analysis of complex samples: classification of the root samples from Cortex moutan. Chemometrics and Intelligent Laboratory Systems 135: 183-191.
- Flumignan DL, de Oliveira FF, Tininis AG, Lopes MN, de Oliveira JE (2008) Development, optimization and validation of gas chromatographic fingerprinting of Brazilian commercial gasoline for quality control. Journal of Chromatography A 1202: 181-188.
- Han J, Ye M, Xu M, Sun J, Wang B, et al. (2007) Characterization of flavonoids in the traditional Chinese herbal medicine-Huangqin by liquid chromatography coupled with electrospray ionization mass spectrometry. Journal of Chromatography B 848: 355-362.
- Jin XF, Lu YH, Wei DZ, Wang ZT (2008) Chemical fingerprint and quantitative analysis of Salvia plebeia R. Br. by high-performance liquid chromatography. Journal of Pharmaceutical and Biomedical Analysis 48: 100-104.
- Yu K, Gong Y, Lin Z, Cheng Y (2007) Quantitative analysis and chromatographic fingerprinting for the quality evaluation of Scutellaria baicalensis Georgi using capillary electrophoresis. Journal of Pharmaceutical and Biomedical Analysis 43: 540-548.
- Chen XF, Wu HT, Tan GG, Zhu ZY, Chai YF (2011) Liquid chromatography coupled with time-of-flight and ion trap mass spectrometry for qualitative analysis of herbal medicines. Journal of Pharmaceutical Analysis 1: 235-245.
- Zeng ZD, Liang YZ, Chau FT, Chen S, Daniel MKW, et al. (2007) Mass spectral profiling: an effective tool for quality control of herbal medicines. Analytica Chimica Acta 604: 89-98.

Open Access Journals
- Aquaculture & Veterinary Science
- Chemistry & Chemical Sciences
- Clinical Sciences
- Engineering
- General Science
- Genetics & Molecular Biology
- Health Care & Nursing
- Immunology & Microbiology
- Materials Science
- Mathematics & Physics
- Medical Sciences
- Neurology & Psychiatry
- Oncology & Cancer Science
- Pharmaceutical Sciences
